Open Manufacture: Revealing SenseCAP T1000’s Reliability through Extreme Temperature Trials
Today, we continue our open manufacture journey of entering the realm of extreme temperature testing, a pivotal phase in affirming the reliability and resilience of SenseCAP T1000 trackers. Ensuring seamless performance in the most demanding environments and extreme conditions, from freezing cold to scorching heat, is our ultimate aim. In this blog, you’ll be walked through how we carried out the rigorous temperature testing, from -20°C to 60°C, which unveils the comprehensive procedures, results, and advancements.
Welcome back to our Open Manufacture series, where we reveal the intricate process of crafting exceptional products. Today, we’re diving into the world of extreme temperature testing, a critical step in ensuring the reliability and resilience of SenseCAP T1000 trackers. Understanding how our devices perform under extreme temperature conditions is crucial, as it ensures that they continue to function flawlessly in the harshest environments, from freezing cold to scorching heat.
Our goal with the SenseCAP T1000 is to guarantee optimal performance in the most challenging conditions, ranging from as low as -20°C to as high as 60°C. To validate this feature, we embarked on an extensive temperature testing journey, pushing our trackers to their limits.
The Testing Process
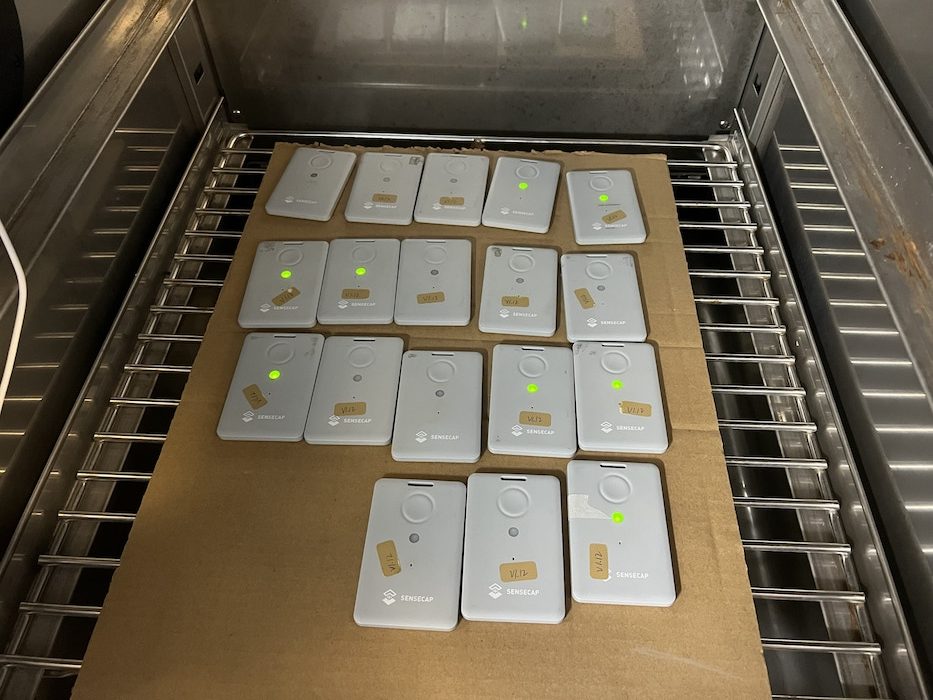
We placed over 150 trackers into a specialized temperature test chamber, ready to endure the extremes. The devices were divided into two batches: one batch remained off, while the other actively transmitted data, set to different modes, such as transmitting data every 5 minutes or 30 minutes.
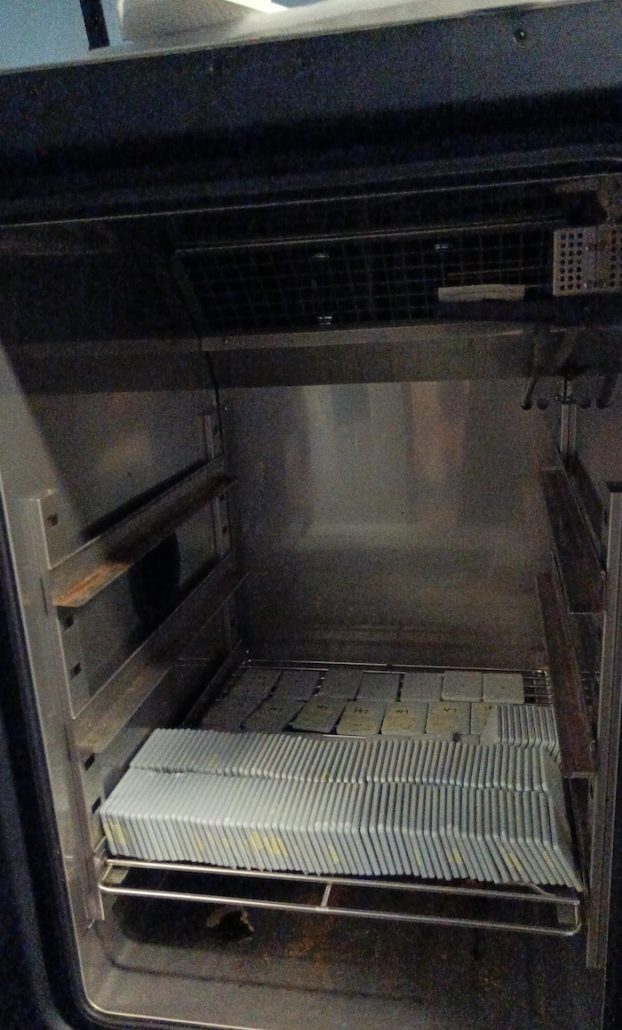
Our temperature test was divided into two parts:
Part 1: From Arctic Chill to Desert Heat
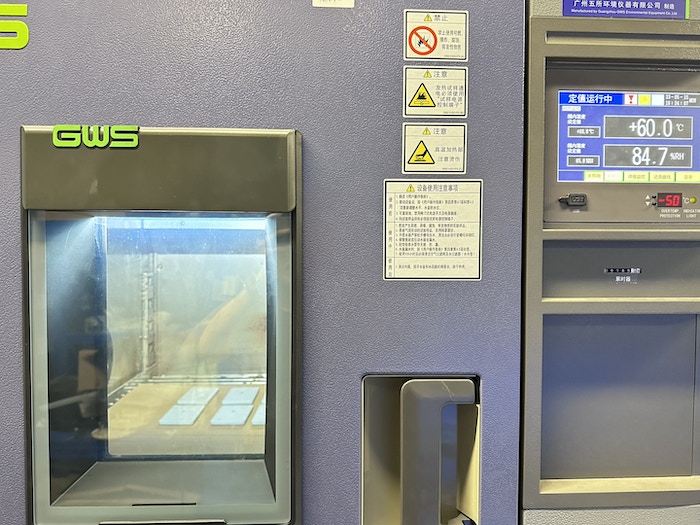
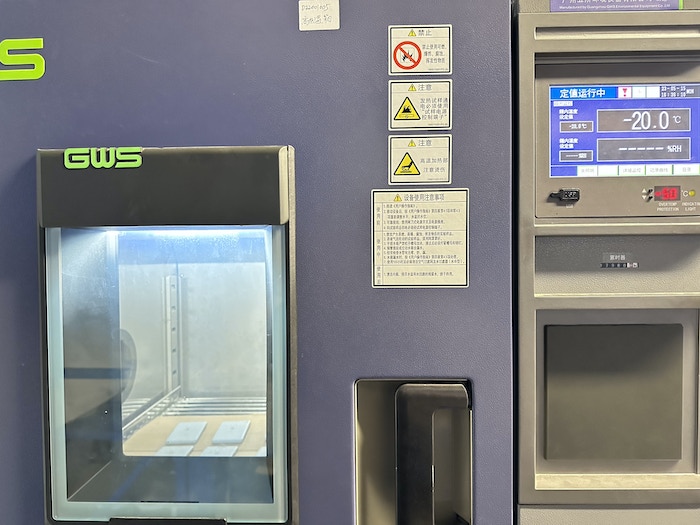
In the first part, both batches of devices endured a frigid -20°C environment for 48 hours. Then, the temperature was raised to a scorching 60°C for another 48 hours. Throughout this 96-hour ordeal, we diligently monitored the active devices to ensure they functioned normally.
Each device in the test had a corresponding Excel sheet where the results were meticulously recorded. The test results for device 2CF7F1C05180000F is given below.

Following this extreme temperature cycling, all devices were retrieved for testing. Devices that were initially off were powered up to check for any startup issues, and a comprehensive functionality test was conducted on all devices. Additionally, we conducted a physical examination to check for any deformations, comparing the thickness of each device before and after the test.
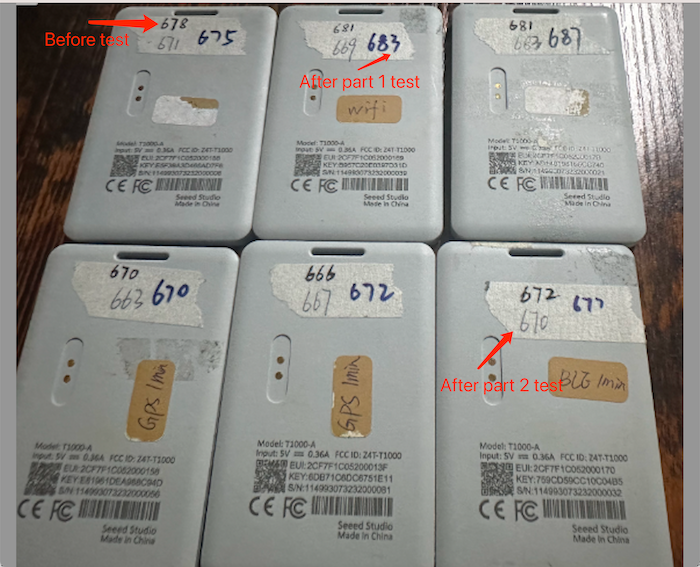
Part 2: Temperature Variations Challenge
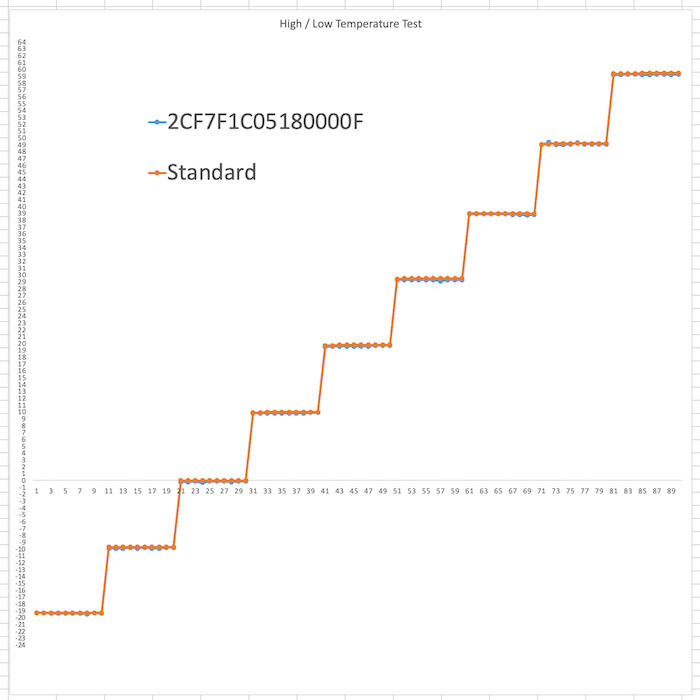
In the second part of our testing, the devices were once again subjected to extreme temperature variations. The temperature test chamber started at -20°C and gradually increased by 10°C per hour, eventually reaching a sizzling 60°C before descending once more.
This phase included the same tests as part one, with a unique focus on verifying the accuracy of the internal temperature sensor readings. T1000 records the temperature multiple times at each interval, and the results showed a discrepancy within an acceptable range, a reassuring sign of the device’s precision. To visually demonstrate these results, we’ve included a photo below:
Results of the Temperature Test
We’re pleased to share that all the samples successfully passed the test. This signifies a substantial stride forward as we move closer to delivering our product, confirming its reliability and durability in extreme environments.
As visual evidence of the testing process, you can find more photos and videos from our testing process in the attachments below.
