Learn TinyML using Wio Terminal and Arduino IDE #3 People Counting and Azure IoT Central Integration
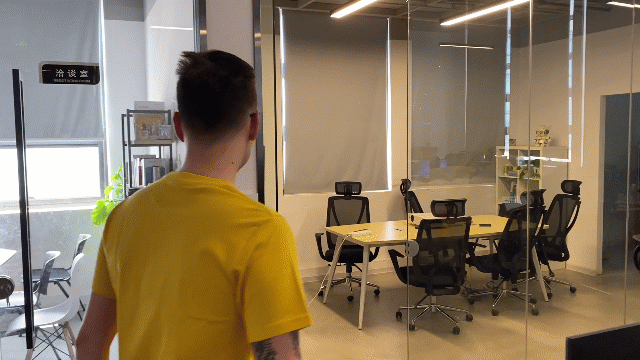
In this article we will create a people counting system by using Wio Terminal, an ordinary Ultrasonic ranger and special Deep Learning sauce to top it off and actually make it work.
We will also utilize Microsoft Azure IoT Central service to store the room occupancy data in the cloud and visualize it on PC.
For more details and video tutorial, watch the corresponding video!
Get to know the data
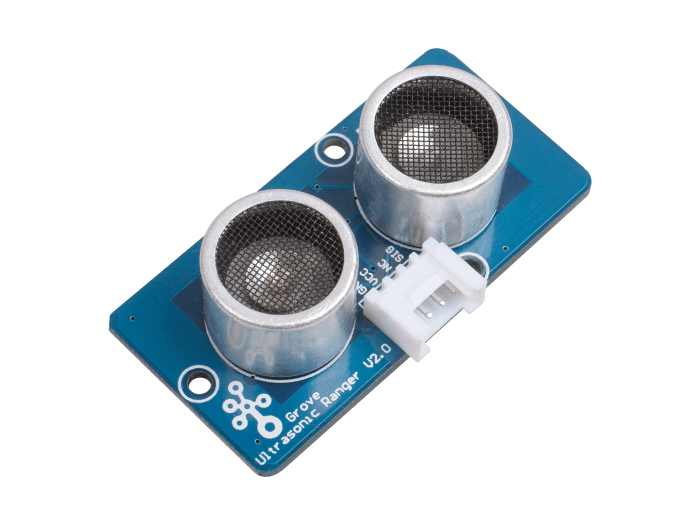
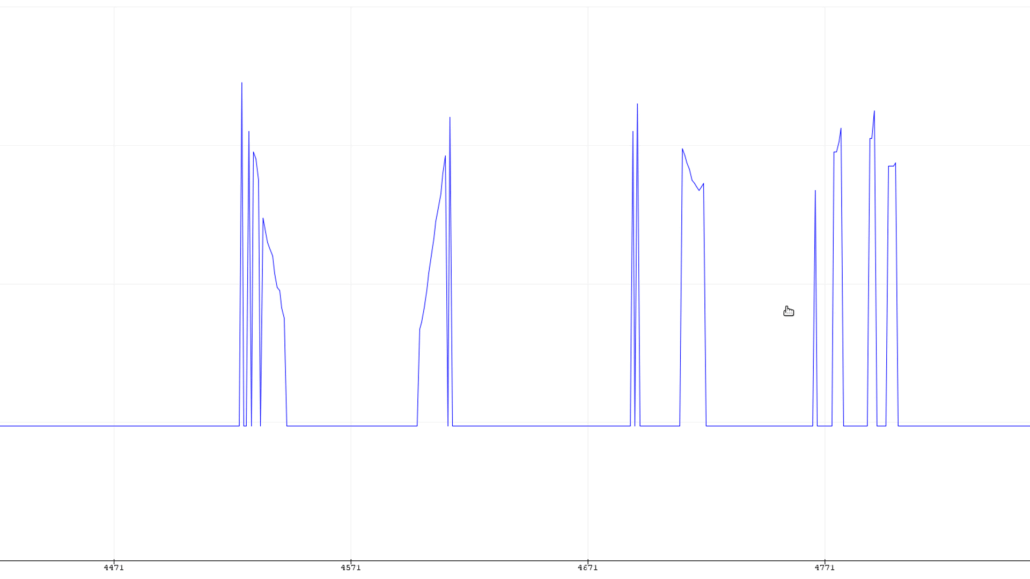
First, let’s understand the data we can get from Ultrasonic sensor and how we can utilize it for determining the direction of objects. We can upload this simple script to Wio Terminal connected to Grove Ultrasonic Ranger and then walk in and walk out of the room.
#include "Ultrasonic.h"
#define INTERVAL_MS 50
Ultrasonic ultrasonic(0);

void setup() {
    Serial.begin(115200);
    }

void loop() {
    static unsigned long last_interval_ms = 0;
    float distance;

    if (millis() > last_interval_ms + INTERVAL_MS) {
        last_interval_ms = millis();
        distance = ultrasonic.MeasureInCentimeters();
        if (distance < 200.0) {
        Serial.println(distance);
        }
        else
        Serial.println(-1);
        //Serial.print('\t');
    }
}
We can immediately see that for walking it, we get relatively high values(corresponding to distance from the object) first, which then decrease. And for walking out, we get completely opposite signal.
Theoretically we could write an algorithm ourselves by hand, that can determine the direction. Unfortunately, real life situations are complicated – we have people that walk fast (shorter curve length) and slow (longer curve length), we have thinner people and people who are not so thin and so on. So our hand-written algorithm needs to take all of these into account, which will inevitably make it complicated and convoluted. We have a task involving inference signal processing and lots of noisy data with significant variations… And the solution is — Deep Learning. Either that, or Sherlock Holmes.
I’ll go with Deep Learning.
Gather the data
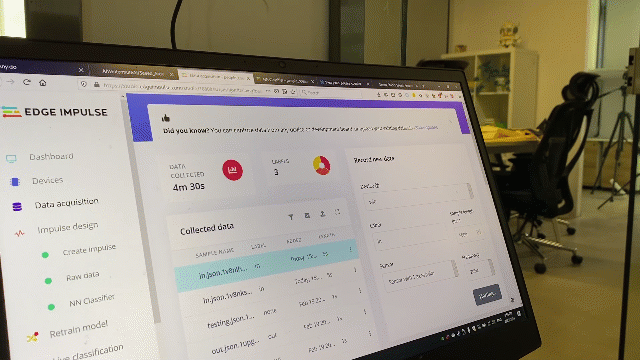
Let’s create a new project in Edge Impulse Dashboard and prepare to get the data. For gathering the data, since we don’t need very high sampling frequency, we can use data forwarder tool from edge-impulse-cli. Upload the ei_people_counter_data_collection.ino script (exactly the same script as pasted above) to Wio Terminal – to learn more about how to set up edge-impulse-cli and data forwarder protocol, watch the first video of TinyML series.
In this particular script we filter out all the values above 200 cm, setting them to -1.
        if (distance < 200.0) {
        Serial.println(distance);
        }
        else
        Serial.println(-1);
For your application you might need to set this value lower or higher, depending on the set up. Then start walking.
I recorded 1 minute 30 seconds of data for every class, each time recording 5000 ms samples and then cropping them to get 1500 ms samples – remember that variety is very important in the dataset, so make sure you have samples where you (or other people) walk fast, slow, run, etc. For none category apart from samples that have nobody in front of the device, it is a good idea to include samples that have a person just standing close to the device and walking beside it, to avoid any movement being falsely classified as in or out.
Find the right processing block and network architecture
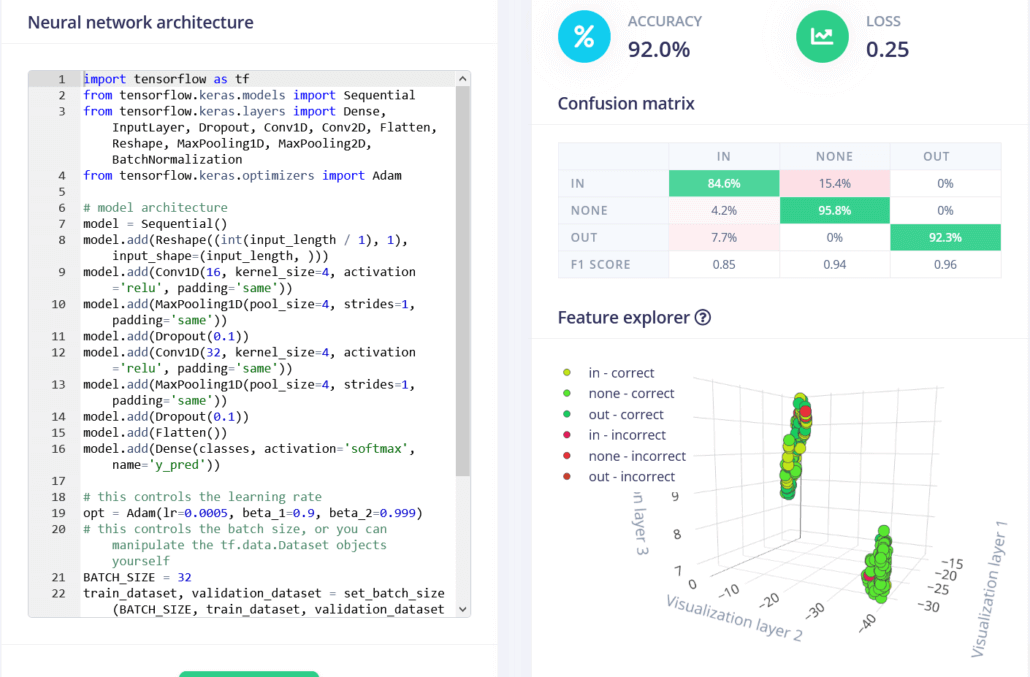
When you are done with data collection, create your impulse – I set window length to 1500 ms and windows size increase to 500 ms.
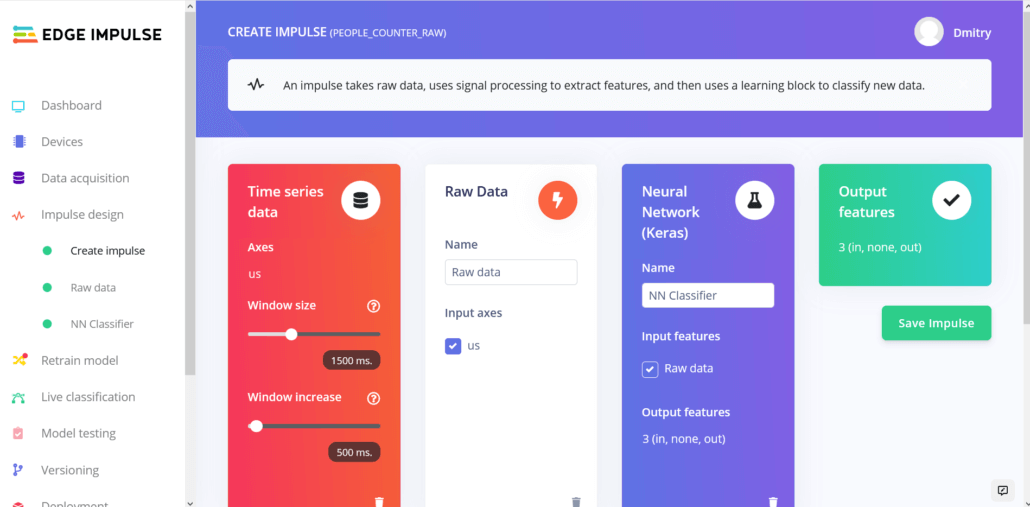
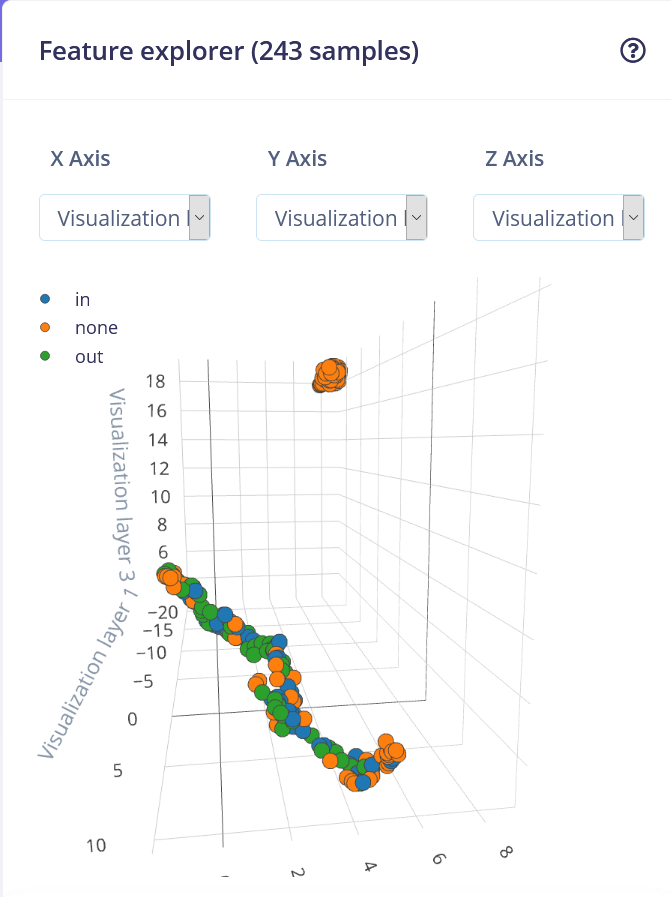
1500 ms is more than enough to cover time duration person needs when walking in the door or walking out, except if moving extremely slow. For processing blocks, we only have two blocks this time to experiment with – Raw data or Spectral analysis. Flatten block will erase all the time-domain information from the data, making it completely useless in determining direction, so we won’t use it. Spectral analysis block applies Fast Fourier transform to data samples, converting signal from time domain to frequency domain. While FFT can work for other types of signals, such as sounds or accelerometer data, in our case the frequency of signal actually also doesn’t matter that much, since we cannot judge if person is coming in or going out of the room based on frequency. If you look at the data visualization after Spectral analysis block, it is clear that it’s hard to separate in and out data samples.
Changing processing block to spectrogram doesn’t really alleviate the problem and resulting accuracy still stays fairly low – the highest I could get was 79.6 %, with a lot of confusion between in and out classes. And the winner, once again is Raw data (with scaling) + 1D Convolutional network. I tweaked network architecture a bit to obtain 92% accuracy, for that I had to switch to “expert” mode and changed MaxPool1D strides to 1 and pool size to 4.
How good is 92% accuracy and what can be done to improve it?
92% is fairly good as proof of concept or prototype, but horrible as a production model. For production, mileage may vary – if your application is critical and somehow used in automated control and decision making, you don’t really want to have anything below 98 – 99 percent and even that might be low, think about something like a face recognition system for payment or authentication. Are there ways to improve the accuracy of this system?
- Ultrasonic sensor is cheap and ubiquitous sensor, but it is relatively slow and not very precise. We can get better data by using Grove TF Mini LiDAR Module.
- Get more data and possibly place the sensor lower, at normal human waist level. I’m 181 cm tall and placed the sensor on the level of my chest only to discover that it misses my shorter and slimmer colleagues.
- Two are better than one – having two sensors taking measurements at slightly different places will not add too much data (we only have 31 data point in each sample), but might increase the accuracy. To explore more interesting ideas, a built-in light sensor can be used if Wio Terminal is appropriately located.
Continuous inference
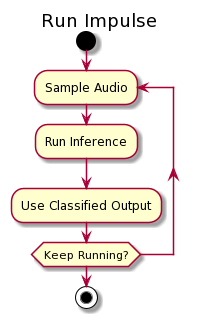
Once the model is trained we can perform live classification with data from device – here I found that window size increase of 500 ms actually doesn’t work that well and produces more false positives, so at the next step, when deploying to the device, I increased the value to 750 ms. To deploy the model to Wio Terminal go to deployment tab, choose Arduino library, download it, extract the archive and put it inside of your Arduino libraries folder.
This time we will be using continuous inference example to make sure we are not missing any important data. Clone Seeed studio example sketches repository and open people_counting_continious.ino sketch with Arduino IDE, change the name of the Edge Impulse library to one matching your project name, choose Wio Terminal as your board, install Grove Ultrasonic sensor library and upload the sketch.
If you remember in the first video of the series, for the inference, we would gather all the data points in the sample, perform the inference and then go back to sampling – that means that when feeding the data to neural network we would pause the data collection and loose some of the data.
That is not optimal and we can use either DMA (Direct Memory Access), threading or multiprocessing to fix this issue.
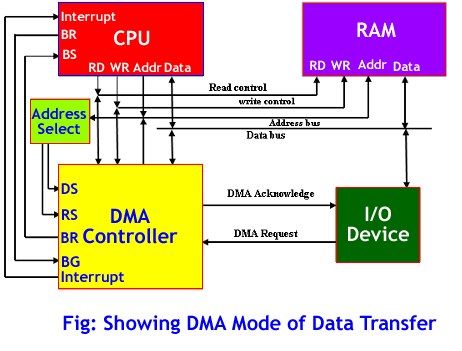
Wio Terminal MCU (Cortex M4F core) only has one core, so multiprocessing is not an option – so in this case we will use FreeRTOS and threads. What is going to happen is that during the inference process, FreeRTOS will pause inference for a brief moment, collect the data sample and then go back to inference.
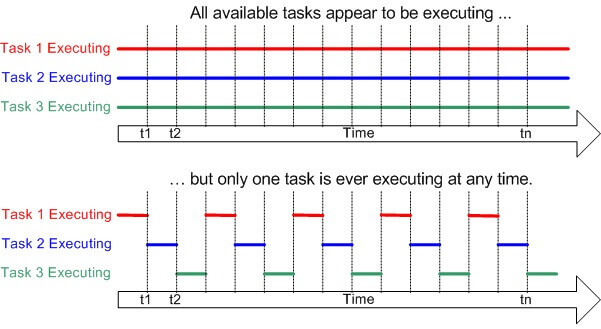
This way the actual inference will take a little longer, but the difference is negligible for this particular use case. We perform inference every 500 ms, so every 500 ms slice of the time window will be performed inference on for 3 times. Then we take the result that has the highest confidence across 3 inferences – for example we have highest confidence for “out” label 2 times and for “none” label one time, thus the result should be classified as “out”. To simplify the testing I added the lines that turn on Wio Terminal screen when person is entering the room and turns it off when a person exits.
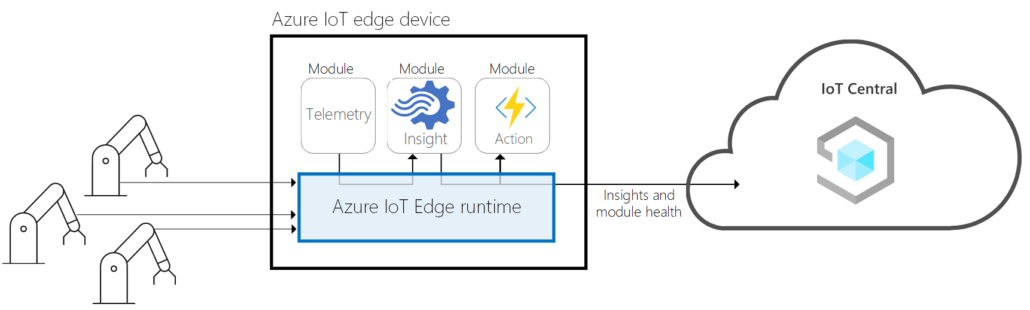
Azure IoT Central Integration
Okay, the model works, but again all in by itself it is not suitable for actually applying it in the real world. Let’s add two elements to make it into a full-fledged application – a simple GUI and data upload to cloud with pretty graphs. We will use LVGL library for creating graphical user interface and Microsoft Azure IoT Central service for sending data to and visualization. The resulting sketch is 693 lines long and has 3 concurrent threads running in RTOS. I spent about 2 days working on ML part of this project and 2 more making GUI, Azure and Edge Impulse work together. All good fun. Here is a quick recap of steps you need to make it work with IoT central.
The code for Azure IoT central connection is modified version of sketch from Seeed Japan Github, which in turn is based on Benjamin Kabe’s original work porting official Azure SDK for C to Wio Terminal. Both Benjamin and Seeed Japanese office used Platform.io with Visual Studio Code – while it is a great framework, which adds a lot of convenience, my tutorials are based on Arduino IDE and I didn’t want to change IDE just for one project. Porting code from VS Code to Arduino IDE is actually quite straightforward:
- I renamed main.cpp to sketch.ino and put the header files from include folder to sketch folder, together with source files.
- azure-sdk-for-c folder needs to be placed inside of Arduino libraries folder and you will need to install a bunch of libraries manually.
- Finally change these lines in Signature.cpp
#include <mbedtls/base64.h>
#include <mbedtls/md.h>
#include <mbedtls/sha256.h>
To just
#include "Seeed_mbedtls.h"Install the necessary libraries:
https://github.com/Seeed-Studio/Seeed_Arduino_rpcWiFi#v1.0.2
=https://github.com/Seeed-Studio/Seeed_Arduino_rpcUnified#v2.1.1
https://github.com/Seeed-Studio/Seeed_Arduino_mbedtls#dev
https://github.com/Seeed-Studio/Seeed_Arduino_FS
https://github.com/Seeed-Studio/Seeed_Arduino_SFUD
https://github.com/sstaub/NTP
PubSubClient
https://github.com/lovyan03/LovyanGFX#0.3.4
https://github.com/ciniml/ExtFlashLoader
https://github.com/Seeed-Studio/Seeed_Arduino_LIS3DHTR
https://github.com/bxparks/AceButton
MsgPack
And it will compile as a normal Arduino IDE project. You can find it in this GIthub repository, under name WioTerminal_Azure_Central.ino, with all changes already made. After the sketch is uploaded, enter configuration mode by pressing three buttons on top of Wio Terminal and resetting the device. “In configuration mode” will be displayed on device screen. Connect to device with Serial monitor (baud rate 115200, carriage return) and set WiFi SSID, password and Azure IoT Central credentials (in the following format set_az_iotc your_ID_scope your_primary_key your_device_ID) , which you can get by following these steps:
- Go to https://apps.azureiotcentral.com/
- If you don’t have a Microsoft account yet, register one.
- Go to Build -> Custom app. Enter the app name and unique URL (can be similar to app name). Choose Free plan.
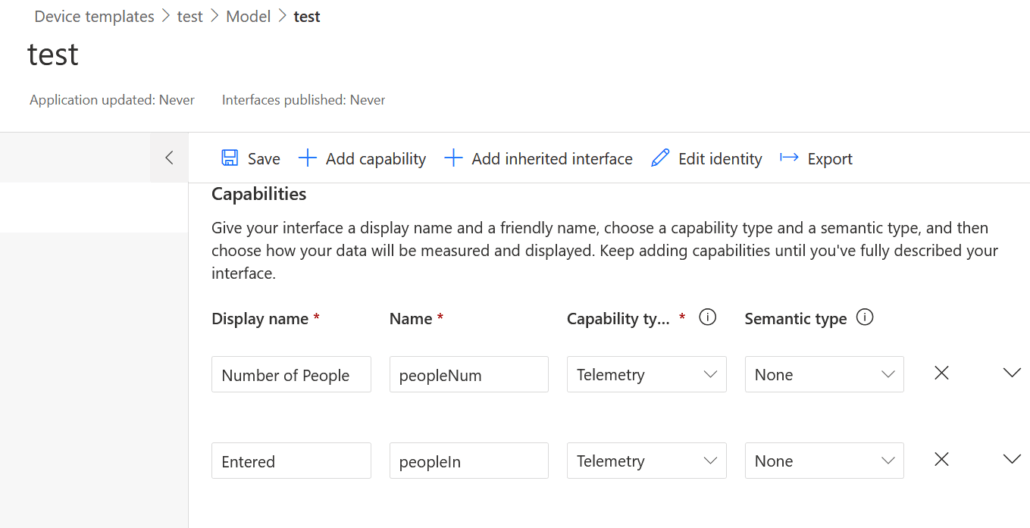
- After an app is created, go to Device Templates. Make a new template of IoT device type. Choose custom model, add three capabilities as in the below screenshot and two interfaces (press on Views -> Visualizing the device). After finishing that and making sure everything is correct, publish the template.
- Create a new device from template by going to Devices and pressing on New, remember to choose the Template you just created and published!
- Get the ID scope from Administration -> Device connection, Primary key from Administration -> Device connection -> SAS-IoT-Devices and device ID from Devices tab, where you created your device on Step 5.
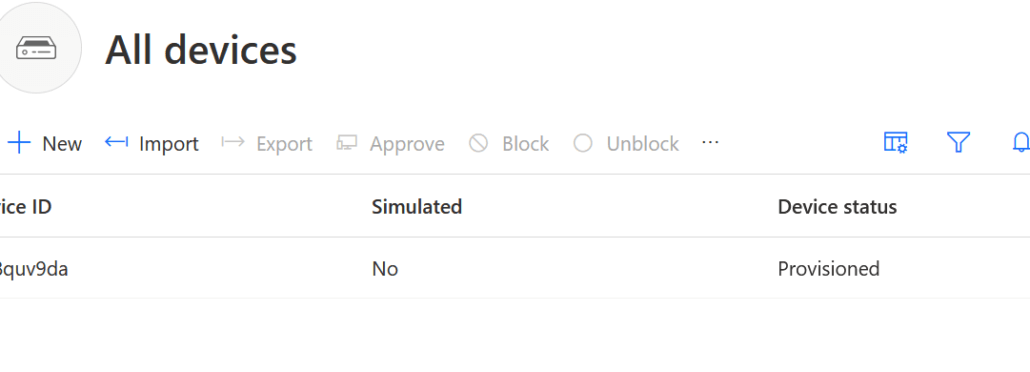
After configuration is successful, restart Wio Terminal and it will start connecting to Azure IoT Central, you can watch the detailed progress feedback on the Serial Terminal. You will then be able to see a) Device status on dashboard has changed to Provisioned b) Telemetry data from Accelerometer sensor in Device -> Raw data.
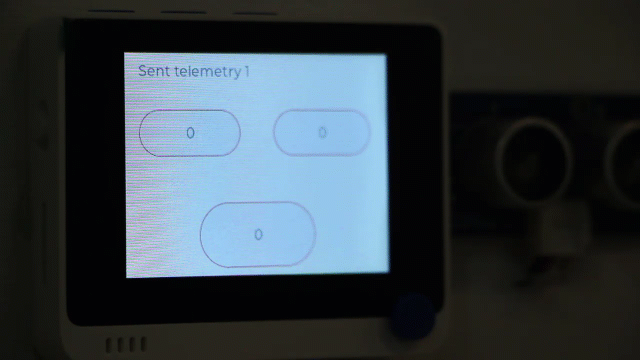
We then add the parts responsible for Edge Impulse model inference, threading and modify send telemetry function to send values for number of people entered, people left and total number of people in the room. We also add simple GUI consisting of three buttons and a text field, which displays information updates – you can see the resulting sketch by opening WioTerminal_EI_People_Counting_Azure_Central_LVGL.ino.
The hardest part was really making sure everything works normally in each separate thread and does not influence other threads. Sacrifices were made in order to accommodate that without over-complicating the code too much, for example placing LVGL task update function right after interface updates and not letting it run periodically saved a lot of headache.
The application we made today with Wio Terminal while not ready for production, but with some additional work can be used to measure and control the occupancy of rooms. Try it out yourself and see the results! Hope you enjoyed the article and the video, stay tuned for next article in TinyML series.