Piechart and Meters Reading using Wio Terminal and Ardupy

It has been 3 months since we released Wio Terminal. We have got a lot of positive feedbacks and awesome projects from the community. Please refer to our continuously updating blog Resource Roundup for Wio Terminal: Tutorials, Reviews, and Projects from Community to get more details for Wio Terminal. Thank you all for liking this cute IoT device!
In this blog, I will take you to look into how to simply use Ardupy to show piechart and meters reading on Wio Terminal. Firstly, let’s figure out what is Ardupy in case you haven’t heard about this extremely easy IDE just released by the Seeed team.
Brief introduction of ArduPy
ArduPy is a combination of Arduino and MicroPython. MicroPython uses the universal Arduino API to control the hardware so that it can be quickly compatible with new platforms. At the same time, we provide aip package manager. You can transform your favourite Arduino library into a MicroPython library. Through ArduPy, you can use Python to verify ideas quickly, learn python programming, and learn Open-Source hardware.
Getting Started
To get started with ArduPy, first need to install aip – ArduPy Integrated Platform is a utility to develop ArduPy and interact witch ArduPy board. It enables users to quickly get started with Ardupy. aip is meant to be a simple command-line tool. You can customize your own Ardupy firmware through it, without needing to know more details about ArduPy.
Install with macOS
For macOS user, you can simply run the following in Terminal to install ArduPy-aip:
pip3 install ardupy-aip Note: please make sure that you have installed Python 3 on macOS. To install Python 3, you can use Homebrew which is a software package manager for macOS. Once installed Homebrew, run the following to install python 3: brew install python3. You can also download and install Python 3 from the official Python website.
Install with Windows
You can download the latest versions of ArduPy for windows in the below session. Once downloaded, extract the binary aip into a directory that is in your PATH.
OR if you have Python 3 environment, you can also install using pip3:
pip3 install ardupy-aip Install with Linux
For Linux user, you can simply run the following in Terminal to install ArduPy-aip:
pip3 install ardupy-aip Note: please make sure you have Python 3 installed and pip3 is up to date.
ArduPy-aip CLI Getting Started
aip is a Command-Line Interface (CLI) for ArduPy, you can use aip to install ArduPy libraries, build and flash ArduPy firmware to hardware with ease. Simply use help to get more information:
aip help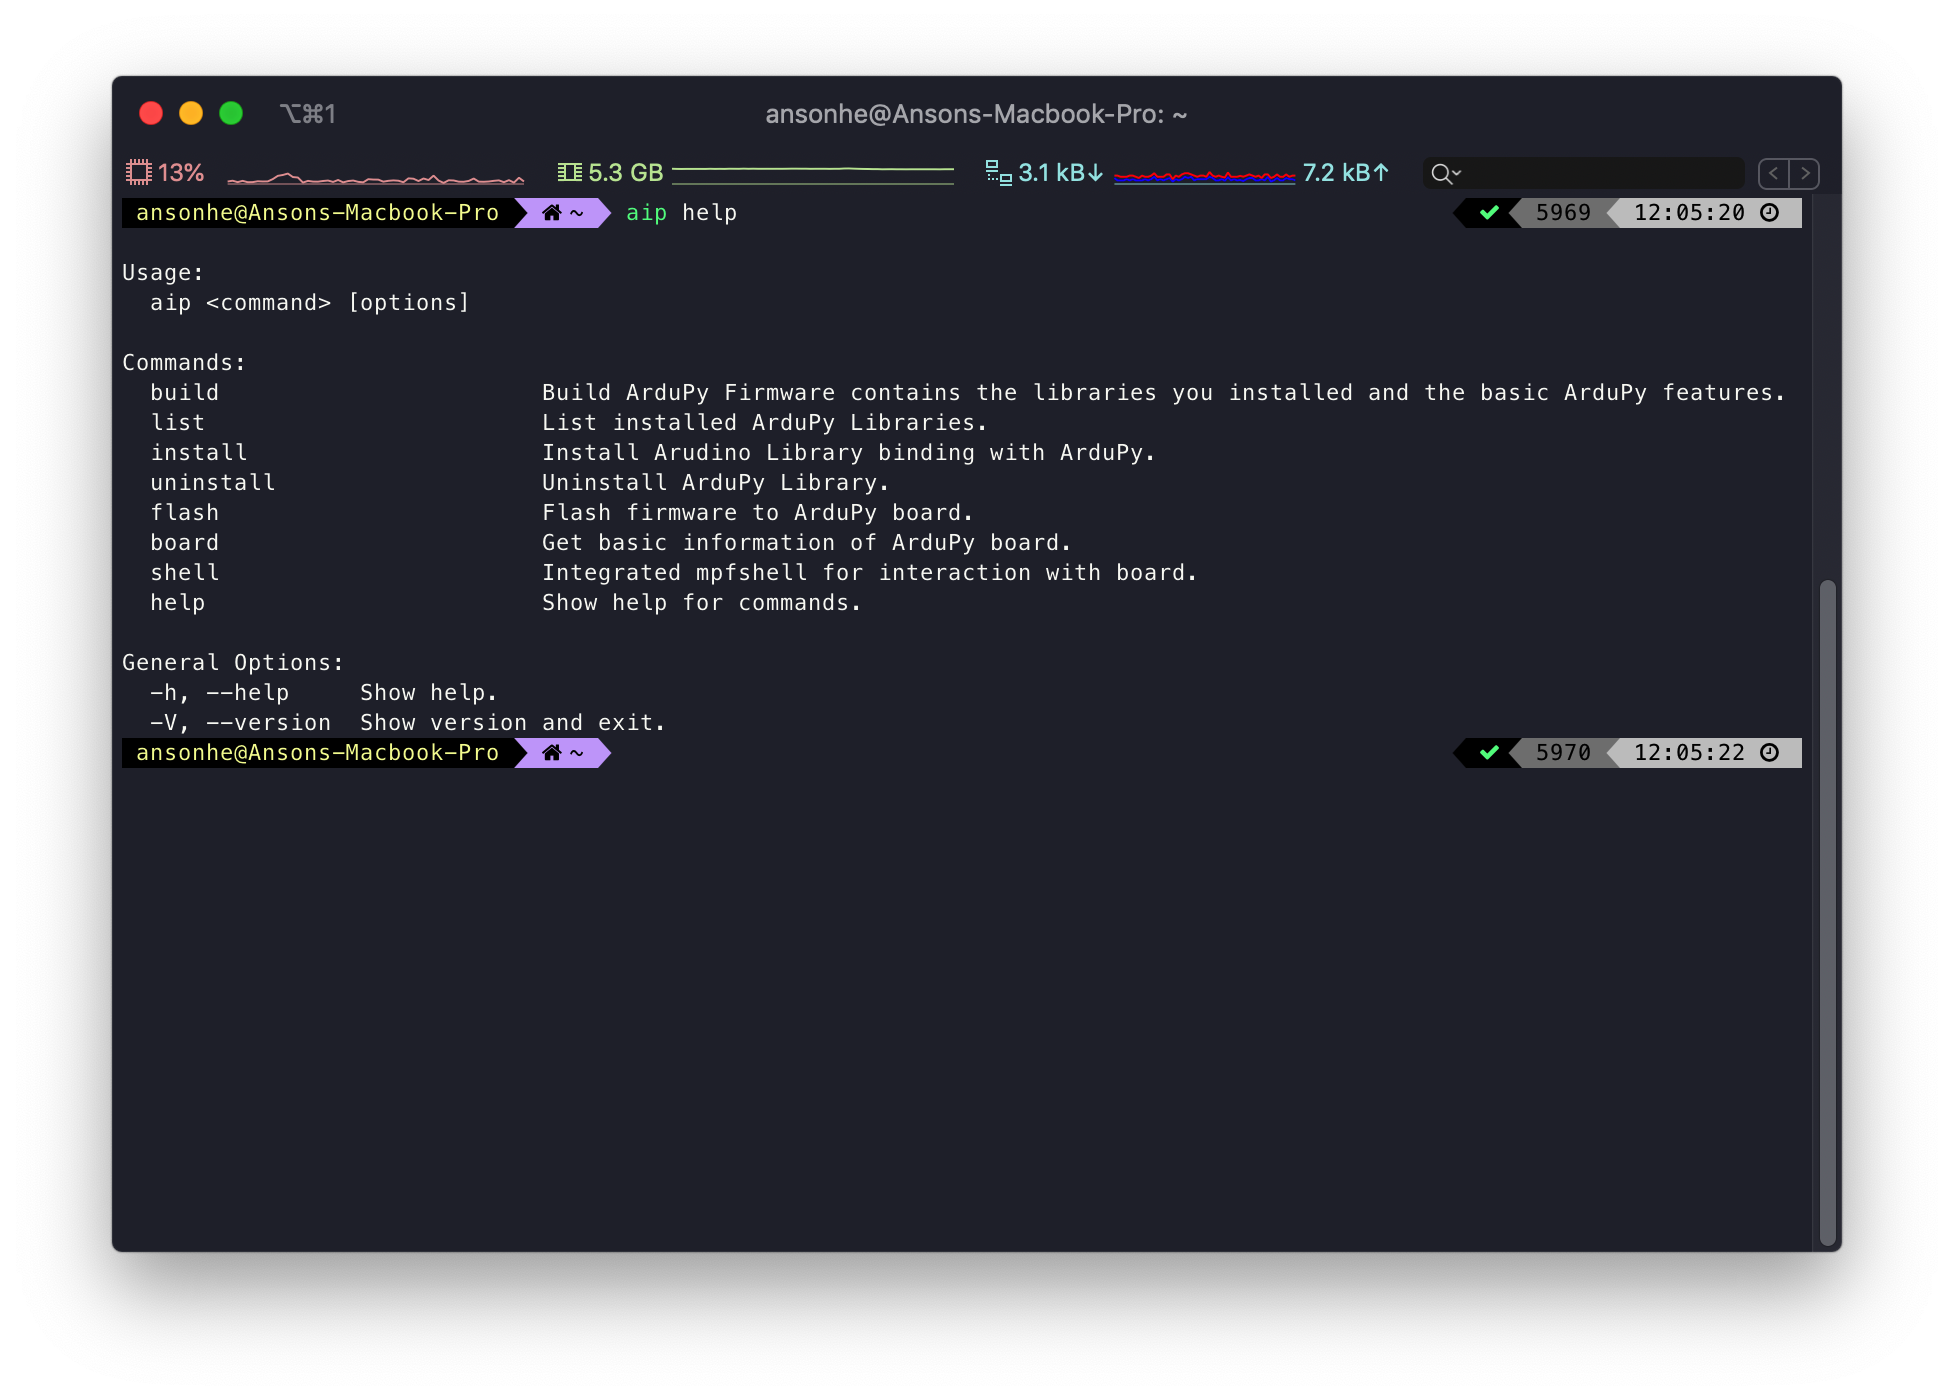
- To get board information:
aip board - To install Arduino libraries binding with ArduPy:
aip install <ArduPy LibraryPath>
# Example Usage:
# aip install Seeed-Studio/seeed-ardupy-ultrasonic-sensor- To uninstall ArduPy libraries:
aip uninstall <ArduPy LibraryPath># Example Usage:# aip uninstall Seeed-Studio/seeed-ardupy-ultrasonic-sensor
- To list installed ArduPy Libraries :
aip list- To build ArduPy Firmware contains the libraries you installed and the basic ArduPy features:
aip build - To flash ArduPy Firmware into hardware:
aip flash - To interact with the board (shell-based file explorer):
aip shell Note: Once entered the ardupy-mpfshell, you can use help for more information and commands.
- To run Python file:
aip shell -n -c "runfile <YourPythonFilePath> [Path]"# Example Usage:# aip shell -n -c "runfile /Users/ansonhe/Desktop/ur.py"
- To load files into the board using the shell:
aip shell -n -c "put <YourPythonFilePath> [Path]"# Example Usage:# aip shell -n -c "put /Users/ansonhe/Desktop/ur.py"
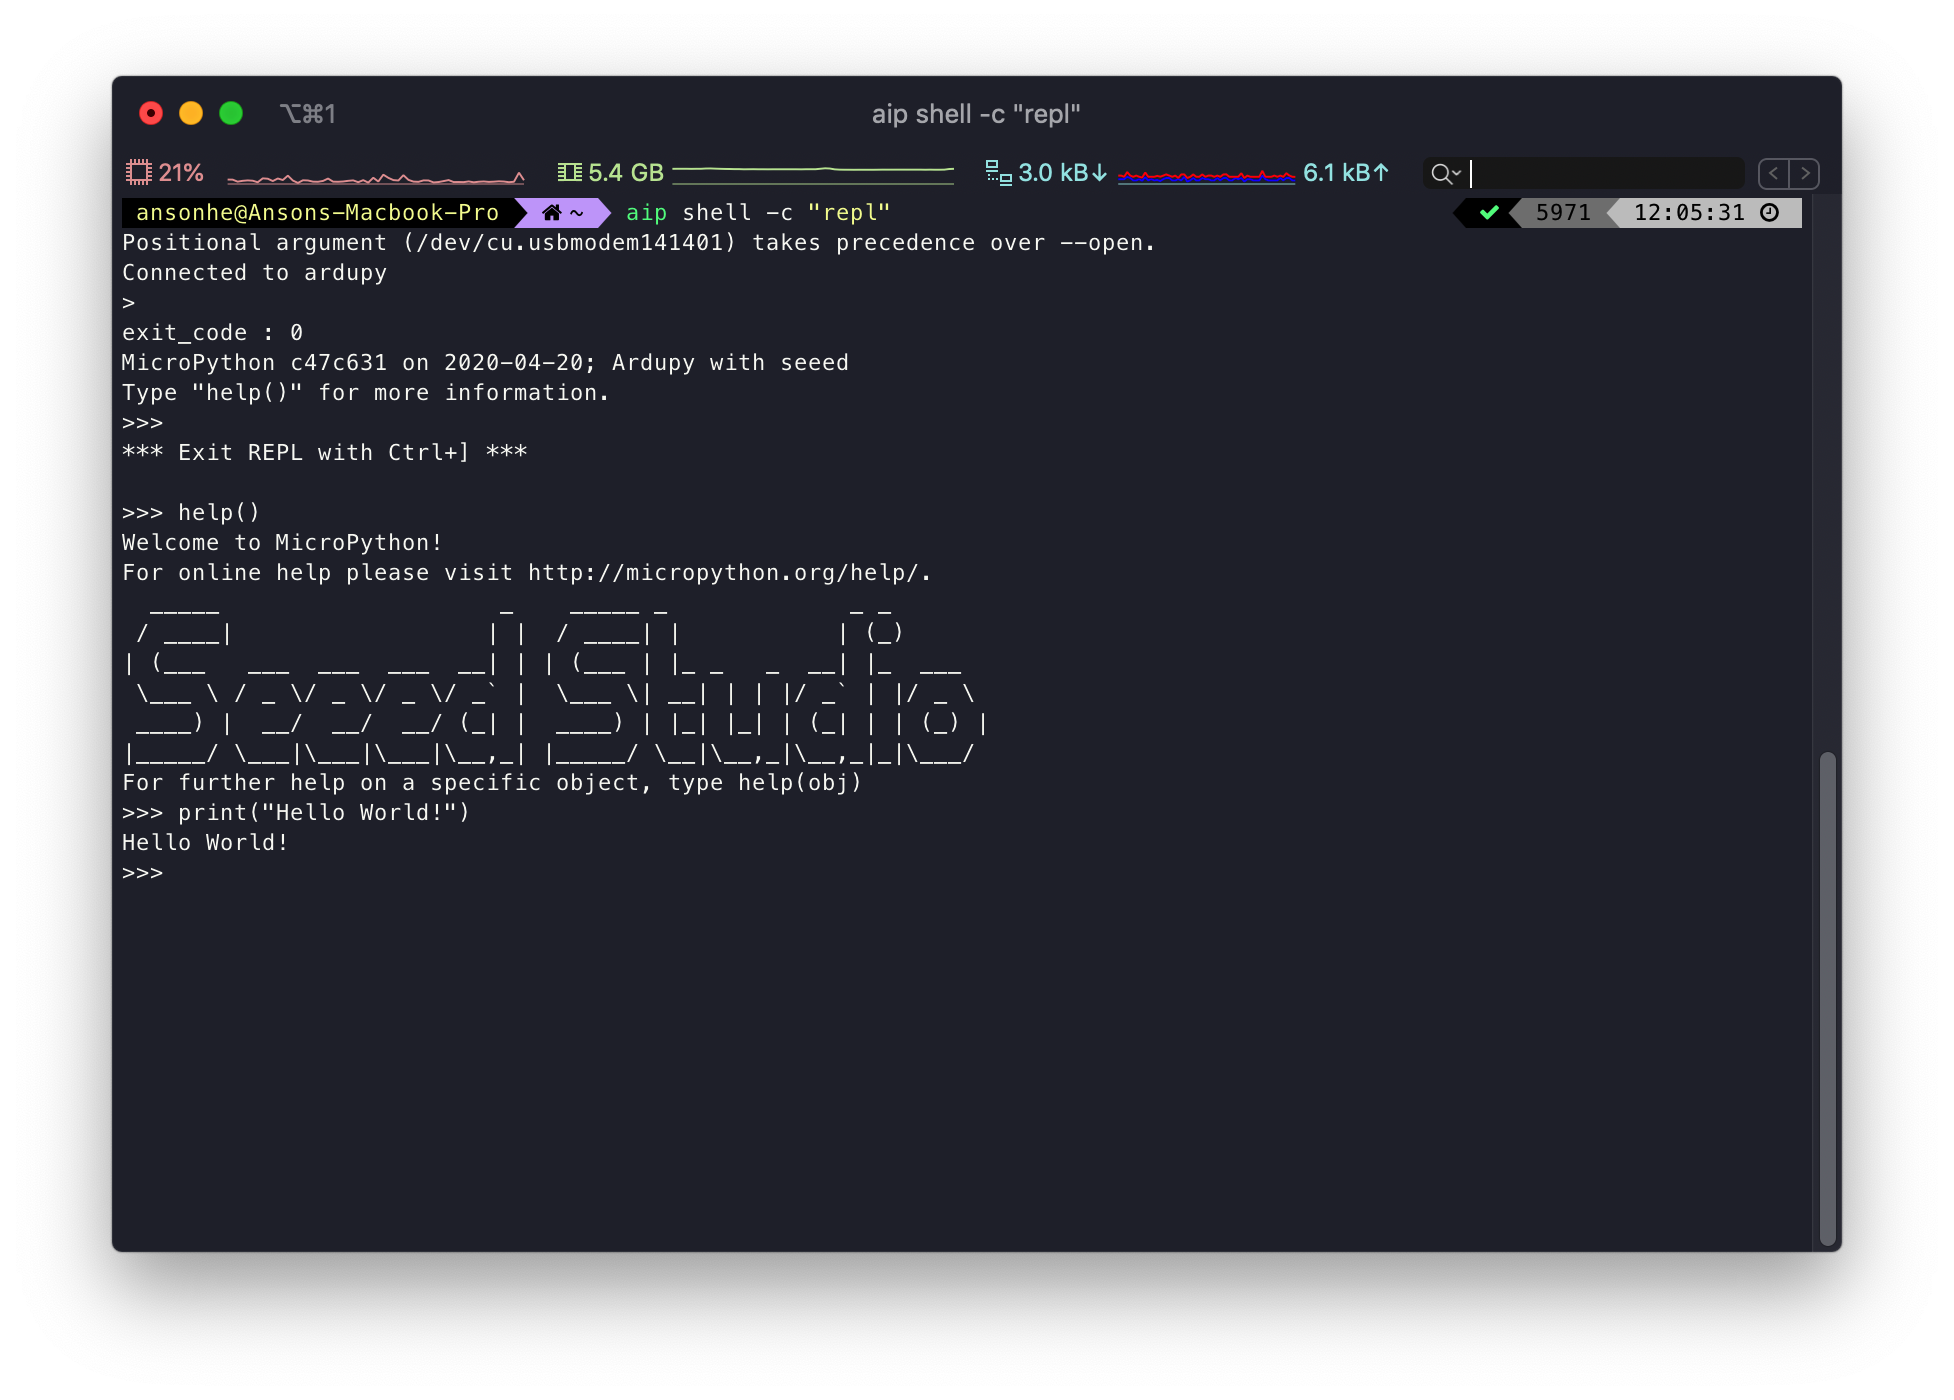
- Entering REPL mode:
aip shell -c "repl"
For further detailed instructions about ArduPy, please visit ArduPy Getting Started to explore.
Immediate usages
Here are two samples illustrating the outcomes of using Wio Terminal with ArduPy:
Usage 1 (PieChart):
aip shell -n -c "runfile <YourPythonFilePath> [Path]"
# Example Usage:
# aip shell -n -c "runfile F:\Ardupy-wio_terminal\PieChart.py
And the outcome will display on the screen of Wio Terminal as below if all settings are installed properly
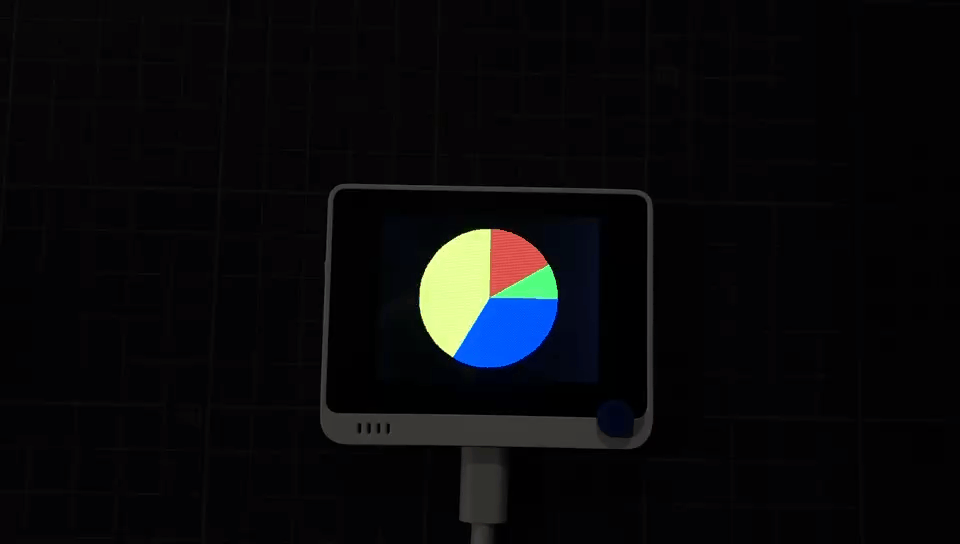
Usage Code:
from machine import LCD, Sprite
import time, math

DEG2RAD = 0.0174532925
lcd = LCD()
lcd.fillScreen(lcd.color.BLACK)

# DRAW CIRCLE SEGMENTS
# x,y == coords of centre of circle
# start_angle = 0 - 359
# sub_angle   = 0 - 360 = subtended angle
# r = radius
# colour = 16 bit colour value

def fillSegment(x, y, startAngle, subAngle, r, color):
    # Calculate first pair of coordinates for segment start
    sx = math.cos((startAngle - 90) * DEG2RAD)
    sy = math.sin((startAngle - 90) * DEG2RAD)
    x1 = sx * r + x
    y1 = sy * r + y

    # Draw colour blocks every inc degrees
    for i in range(startAngle, startAngle+subAngle, 1):
        # Calculate pair of coordinates for segment end
        x2 = math.cos((i + 1 - 90) * DEG2RAD) * r + x
        y2 = math.sin((i + 1 - 90) * DEG2RAD) * r + y

        lcd.fillTriangle(int(x1), int(y1), int(x2), int(y2), x, y, color)

        # Copy segment end to segment start for next segment
        x1 = x2
        y1 = y2

def main():
    # Draw 4 pie chart segments
    fillSegment(160, 120, 0, 60, 100, lcd.color.RED)
    fillSegment(160, 120, 60, 30, 100, lcd.color.GREEN)
    fillSegment(160, 120, 60 + 30, 120, 100, lcd.color.BLUE)
    fillSegment(160, 120, 60 + 30 + 120, 150, 100, lcd.color.YELLOW)
    time.sleep(1)
    fillSegment(160, 120, 0, 360, 100, lcd.color.BLACK)

if __name__ == "__main__":
    while True:
        main()
Usage 2 (Meter):
aip shell -n -c "runfile [Path]"# Example Usage:# aip shell -n -c "runfile F:\Ardupy-wio_terminal\Meter.py"
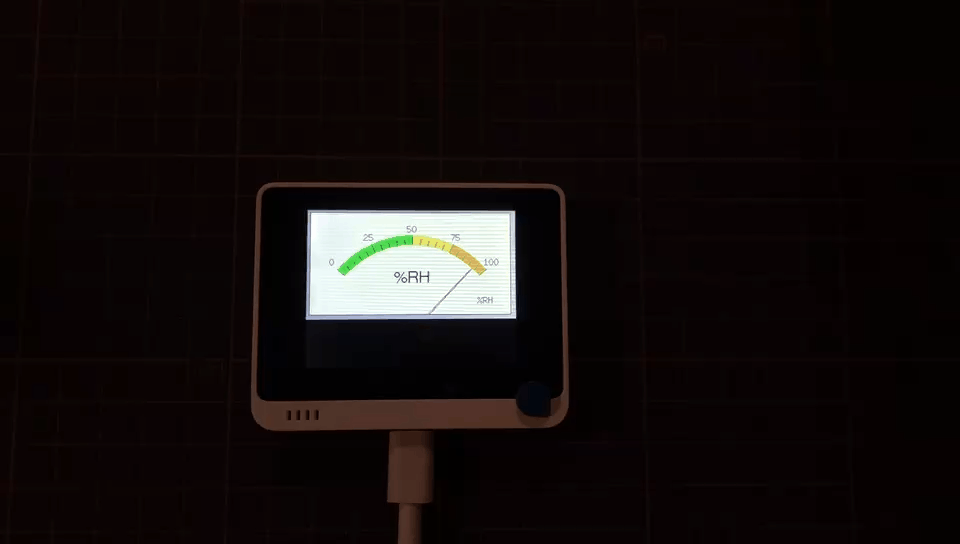
Usage code:
from machine import LCD
import time, math

M_SIZE = 1.3333
LOOP_PERIOD = 35

ltx = 0
osx = M_SIZE * 120
osy = M_SIZE * 120
updateTime = 0
old_analog = -999
d = 0

tft = LCD()
tft.fillScreen(tft.color.BLACK)

def valmap(value, istart, istop, ostart, ostop):
  return ostart + (ostop - ostart) * ((value - istart) / (istop - istart))

def plotNeedle(value, ms_delay):
    global old_analog
    global osx, osy, ltx
    tft.setTextColor(tft.color.BLACK, tft.color.WHITE)
    if (value < -10):
        value = -10   # Limit value to emulate needle end stops

    if (value > 110):
        value = 110

    while(value != old_analog):
        if (old_analog < value):
            old_analog+=1
        else:
            old_analog-=1

        if (ms_delay == 0):
            old_analog = value

        sdeg = valmap(old_analog, -10, 110, -150, -30) # Map value to angle
        # Calculate tip of needle coords
        sx = math.cos(sdeg * 0.0174532925)
        sy = math.sin(sdeg * 0.0174532925)

        # Calculate x delta of needle start (does not start at pivot point)
        tx = math.tan((sdeg + 90) * 0.0174532925)

        # Erase old needle image
        tft.drawLine(int(M_SIZE * (120 + 20 * ltx - 1)), int(M_SIZE * (140 - 20)), int(osx - 1), int(osy), tft.color.WHITE)
        tft.drawLine(int(M_SIZE * (120 + 20 * ltx)), int(M_SIZE * (140 - 20)), int(osx), int(osy), tft.color.WHITE)
        tft.drawLine(int(M_SIZE * (120 + 20 * ltx + 1)), int(M_SIZE * (140 - 20)), int(osx + 1), int(osy), tft.color.WHITE)

        # Re-plot text under needle
        tft.setTextColor(tft.color.BLACK);
        tft.drawCentreString("%RH", int(M_SIZE * 120), int(M_SIZE * 70), 4); # Comment out to avoid font 4

        # Store new needle end coords for next erase
        ltx = tx
        osx = M_SIZE * (sx * 98 + 120)
        osy = M_SIZE * (sy * 98 + 140)

        # Draw the needle in the new postion, magenta makes needle a bit bolder
        # draws 3 lines to thicken needle
        tft.drawLine(int(M_SIZE * (120 + 20 * ltx - 1)),int( M_SIZE * (140 - 20)), int(osx - 1), int(osy), tft.color.RED)
        tft.drawLine(int(M_SIZE * (120 + 20 * ltx)), int(M_SIZE * (140 - 20)), int(osx), int(osy), tft.color.MAGENTA)
        tft.drawLine(int(M_SIZE * (120 + 20 * ltx + 1)), int(M_SIZE * (140 - 20)), int(osx + 1), int(osy), tft.color.RED)

        if(math.fabs(old_analog - value) < 10):
            ms_delay += ms_delay / 5

        time.sleep(ms_delay)

def analogMeter():
    tft.fillRect(0, 0, int(M_SIZE * 239), int(M_SIZE * 126), tft.color.LIGHTGREY)
    tft.fillRect(5, 3, int(M_SIZE * 230), int(M_SIZE * 119), tft.color.WHITE)

    tft.setTextColor(tft.color.BLACK)

    # Draw ticks every 5 degrees from -50 to +50 degrees (100 deg. FSD swing)
    for i in range(-50, 51, 5):
        # Long scale tick length
        tl = 15

        # Coordinates of tick to draw
        sx = math.cos((i - 90) * 0.0174532925)
        sy = math.sin((i - 90) * 0.0174532925)
        x0 = sx * (M_SIZE * 100 + tl) + M_SIZE * 120
        y0 = sy * (M_SIZE * 100 + tl) + M_SIZE * 140
        x1 = sx * M_SIZE * 100 + M_SIZE * 120
        y1 = sy * M_SIZE * 100 + M_SIZE * 140

        # Coordinates of next tick for zone fill
        sx2 = math.cos((i + 5 - 90) * 0.0174532925)
        sy2 = math.sin((i + 5 - 90) * 0.0174532925)
        x2 = sx2 * (M_SIZE * 100 + tl) + M_SIZE * 120
        y2 = sy2 * (M_SIZE * 100 + tl) + M_SIZE * 140
        x3 = sx2 * M_SIZE * 100 + M_SIZE * 120
        y3 = sy2 * M_SIZE * 100 + M_SIZE * 140

        # Yellow zone limits
        if (i >= -50 and i < 0):
          tft.fillTriangle(int(x0), int(y0), int(x1), int(y1), int(x2), int(y2), tft.color.GREEN)
          tft.fillTriangle(int(x1), int(y1), int(x2), int(y2), int(x3), int(y3),tft.color.GREEN)

        # Green Zone limits
        if (i >= 0 and i < 25):
            tft.fillTriangle(int(x0), int(y0), int(x1), int(y1), int(x2), int(y2), tft.color.YELLOW)
            tft.fillTriangle(int(x1), int(y1), int(x2), int(y2), int(x3), int(y3), tft.color.YELLOW)

        # Orange zone limits
        if (i >= 25 and i < 50):
            tft.fillTriangle(int(x0), int(y0), int(x1), int(y1), int(x2), int(y2), tft.color.ORANGE)
            tft.fillTriangle(int(x1), int(y1), int(x2), int(y2), int(x3), int(y3), tft.color.ORANGE)

        # Short scale tick length
        if (i % 25 != 0):
            tl = 8
        # Recalculate coords incase tick length changed
        x0 = sx * (M_SIZE * 100 + tl) + M_SIZE * 120
        y0 = sy * (M_SIZE * 100 + tl) + M_SIZE * 140
        x1 = sx * M_SIZE * 100 + M_SIZE * 120
        y1 = sy * M_SIZE * 100 + M_SIZE * 140

        # Draw tick
        tft.drawLine(int(x0), int(y0), int(x1), int(y1), tft.color.BLACK)

        # Check if labels should be drawn, with position tweaks
        if (i % 25 == 0):
            x0 = sx * (M_SIZE * 100 + tl + 10) + M_SIZE * 120
            y0 = sy * (M_SIZE * 100 + tl + 10) + M_SIZE * 140

            if(i/25 == -2 ):
                tft.drawCentreString("0", int(x0), int(y0) - 12, 2)
            elif (i/25 == -1 ):
                tft.drawCentreString("25", int(x0), int(y0) - 9, 2)
            elif (i/25 == -0 ):
                tft.drawCentreString("50", int(x0), int(y0) - 7, 2)
            elif (i/25 == 1 ):
                tft.drawCentreString("75", int(x0), int(y0) - 9, 2)
            elif (i/25 == 2 ):
                tft.drawCentreString("100", int(x0), int(y0) - 12, 2)

            # Now draw the arc of the scale
            # sx = math.cos((i + 5 - 90) * 0.0174532925)
            # sy = math.sin((i + 5 - 90) * 0.0174532925)
            # x0 = sx * M_SIZE * 100 + M_SIZE * 120
            # y0 = sy * M_SIZE * 100 + M_SIZE * 140
            # # Draw scale arc, don't draw the last part
            # if (i < 50):
            #     tft.drawLine(int(x0), int(y0), int(x1), int(y1), tft.color.BLACK)

        tft.drawString("%RH", int(M_SIZE * (5 + 230 - 40)), int(M_SIZE * (119 - 20)), 2); # Units at bottom right
        tft.drawCentreString("%RH", int(M_SIZE * 120), int(M_SIZE * 70), 4); # Comment out to avoid font 4
        tft.drawRect(5, 3, int(M_SIZE * 230), int(M_SIZE * 119), tft.color.BLACK); # Draw bezel line

        plotNeedle(0, 0)


def initial():
    analogMeter()
    updateTime = time.ticks_ms()

def main():
    global updateTime, d
    if (updateTime <= time.ticks_ms()):
        updateTime = time.ticks_ms() + 100
        d += 4
        if (d >= 360):
            d = 0

        value = 50 + 50 * math.sin((d+0)*0.0174532925)
        print(value)
        plotNeedle(value, 0)


if __name__ == "__main__":
    initial()
    while True:
        main()
Don’t hesitate to visit our Wiki for further interesting usages and also don’t forget to submit any technical issue into our Forum.